Viewing a Test Run
A single view for examining a test run, as well as inspecting and modifying a test.
All test runs associated with a test can be viewed by clicking on the test name from the main Reflect screen. The page that’s displayed is the test’s definition page, and includes a Test Runs section that displays all test runs for the test within the account’s retention period. The test definition page also includes additional metadata about the test, such as its Folders.
Runs View
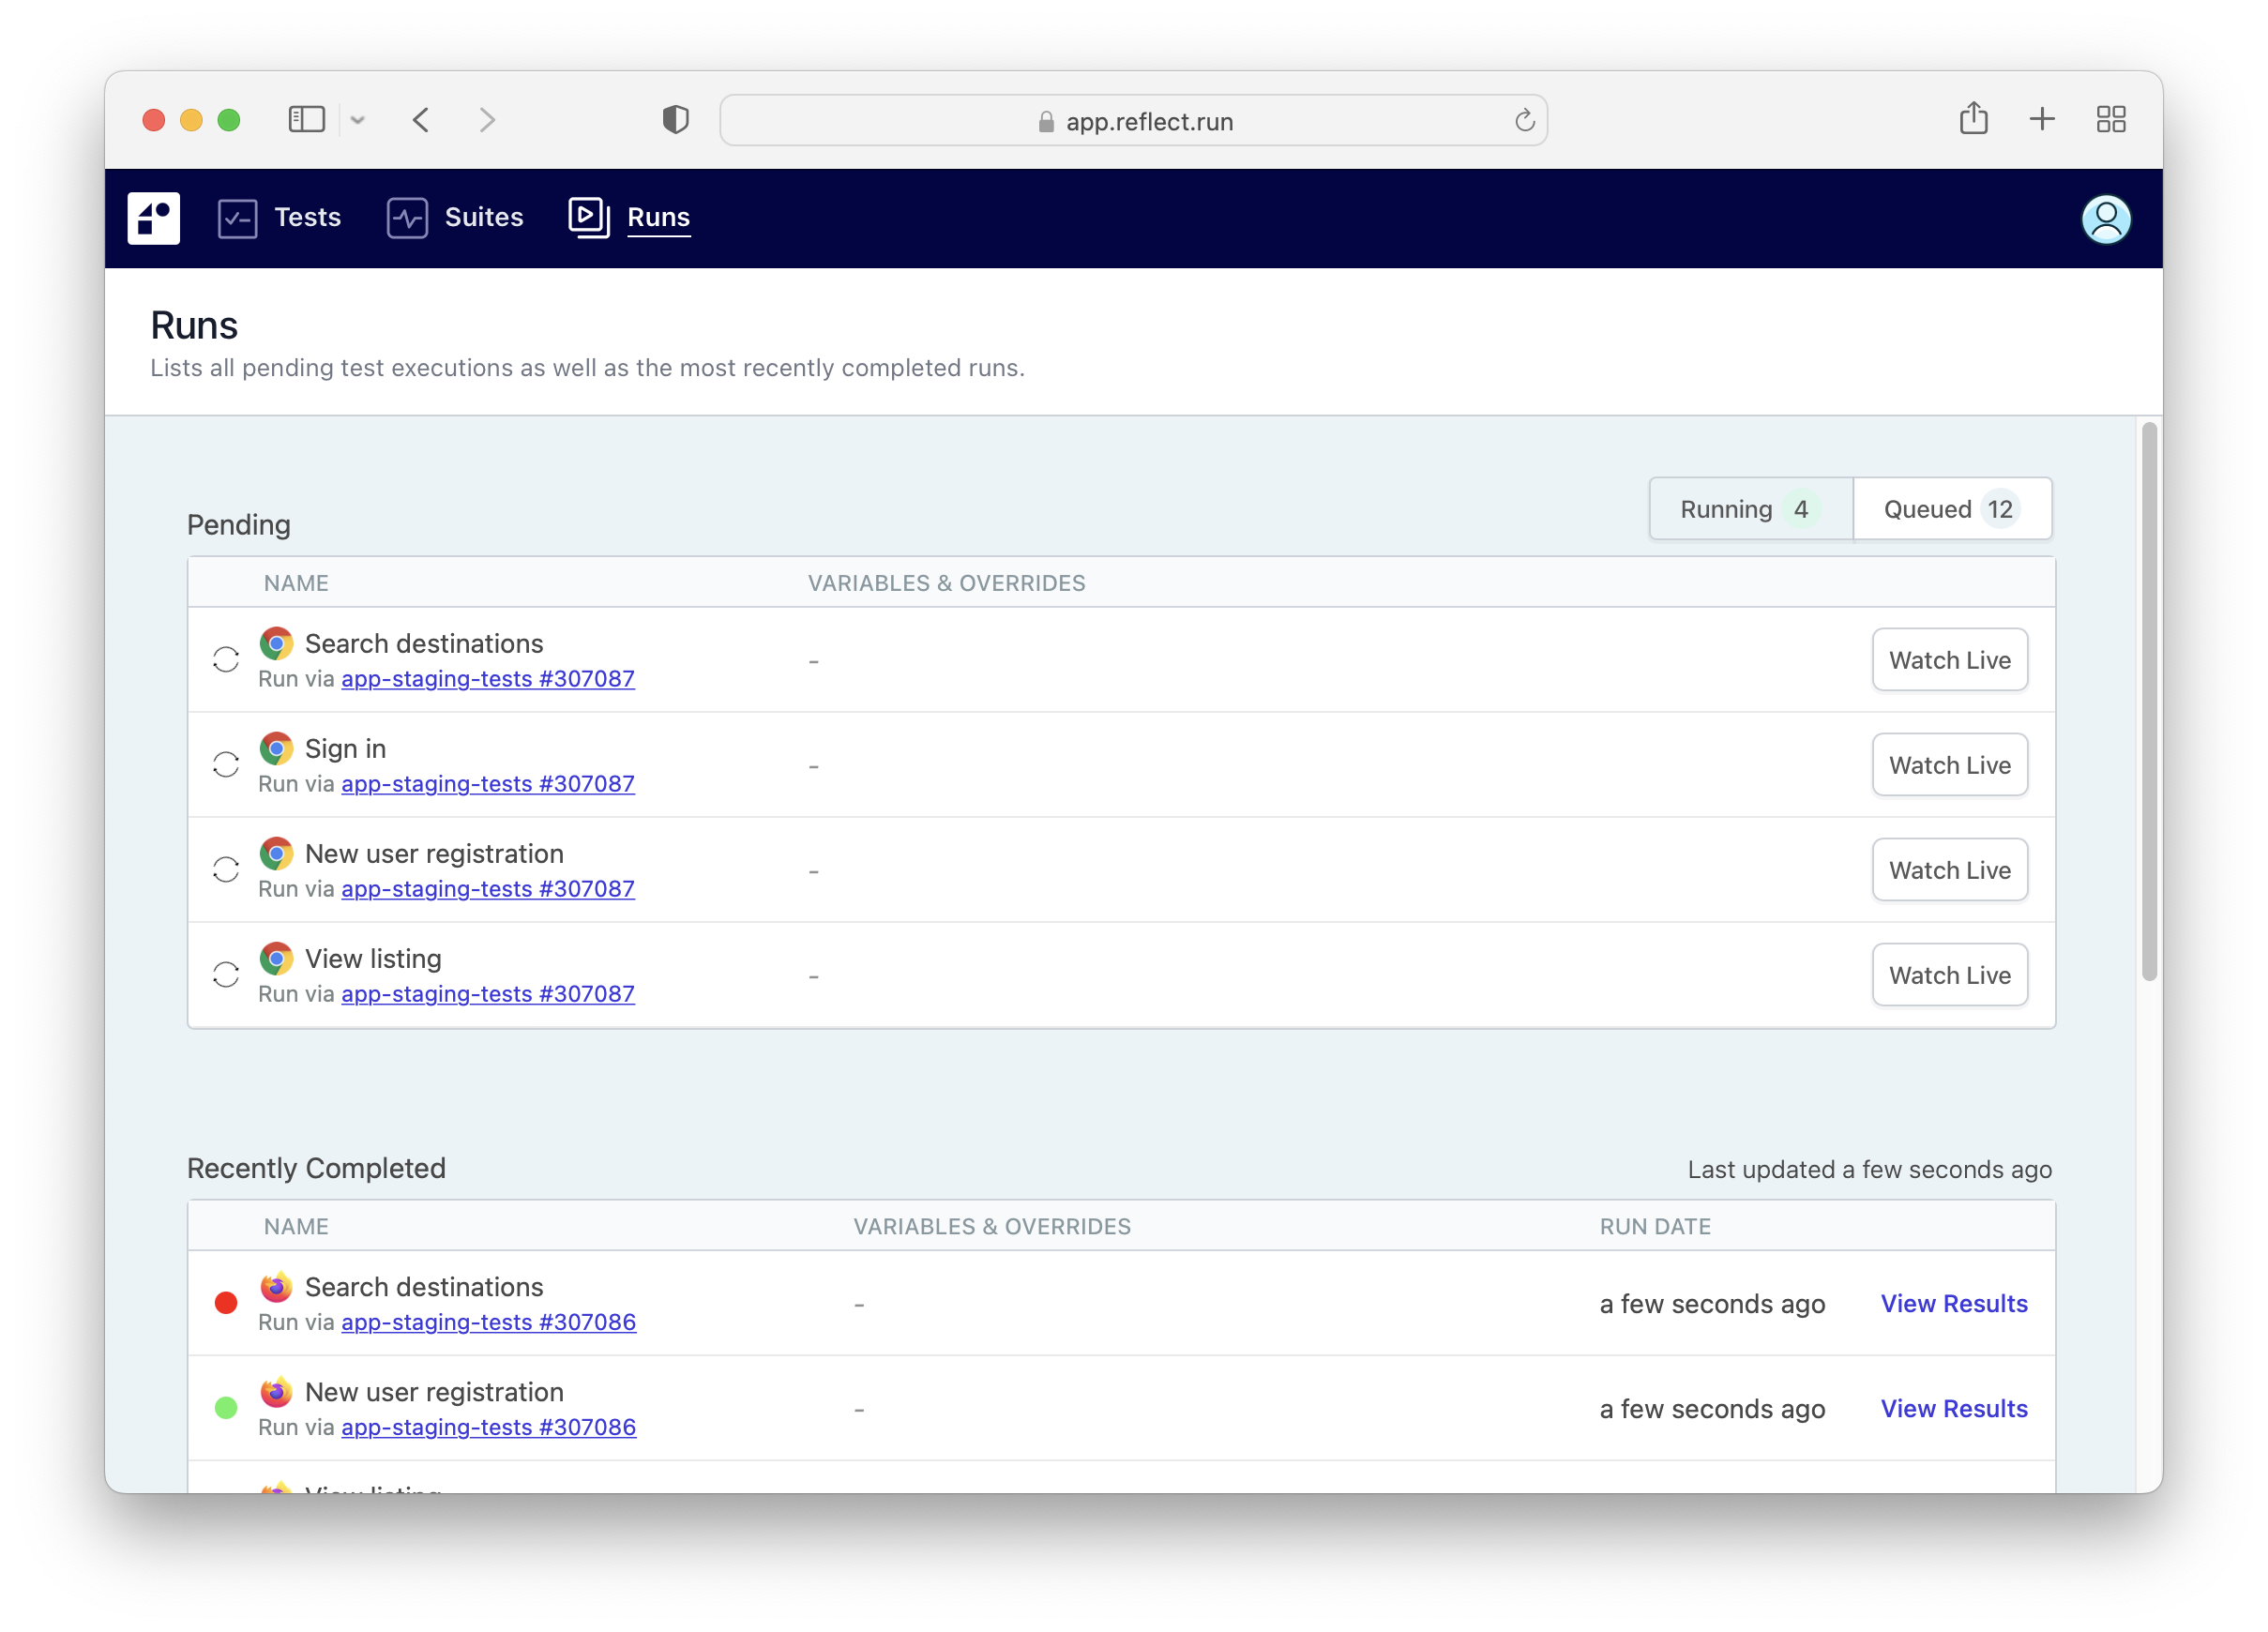
The Runs view, which can be found by clicking on the Runs option on the top nav, displays all pending and in-progress test runs as well as a list of the most recently completed test runs.
Test runs that are in progress can be viewed in real time by clicking the Watch Live button.
Test Detail View
After clicking on a test run, a new page will display the details of the run, including:
- The results for each test step that was executed
- A video of the test execution
- The network and console logs associated with the run
The video recording of the test run is located on the right side of the page. The video automatically begins playback when the page is loaded, and if the test run resulted in failure, the playback skips ahead to the execution of the final test step. The panel below the video displays the console and network logs that were captured during execution.
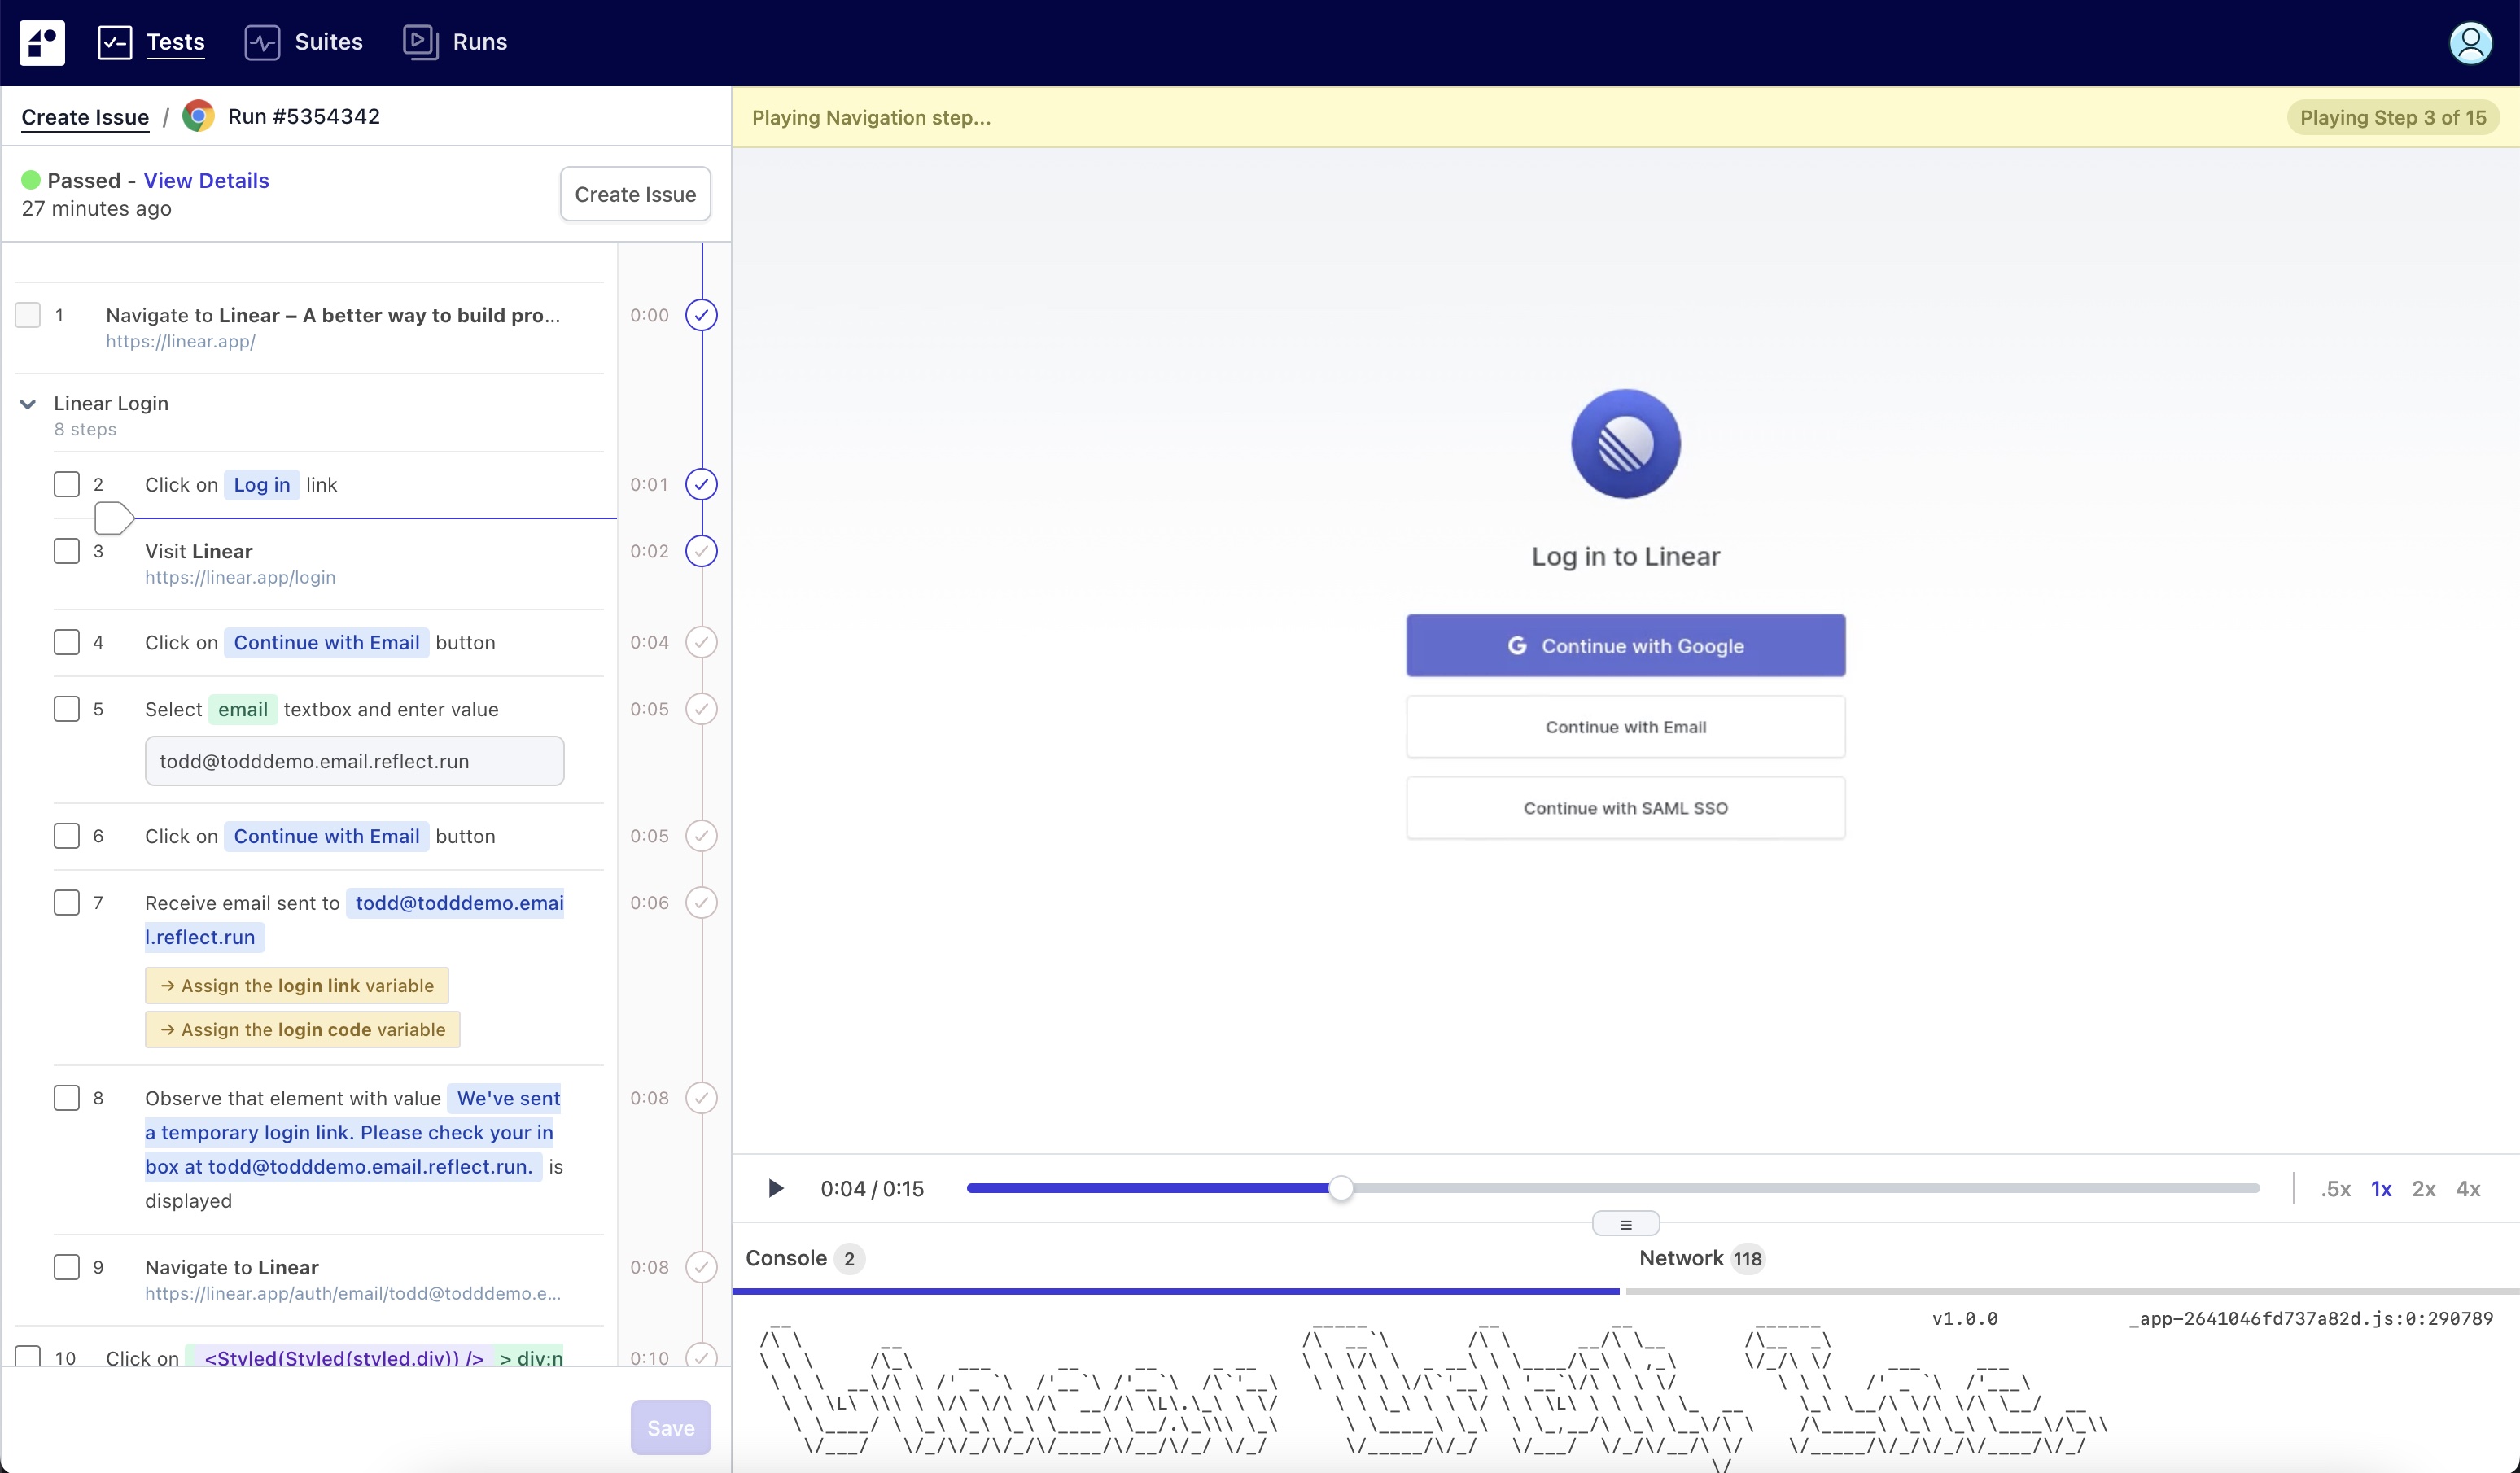
The left sidebar displays the test definition, which is displayed as a simple text description of the ordered test steps. The test steps are highlighted in-sync as the video plays so that you can easily identify the currently executing test step.
Test Step Detail View
Test steps are interactive and after hovering over a test step on the sidebar and clicking the Details button, a new panel is displayed with detailed information about the test step’s execution in the current test run.
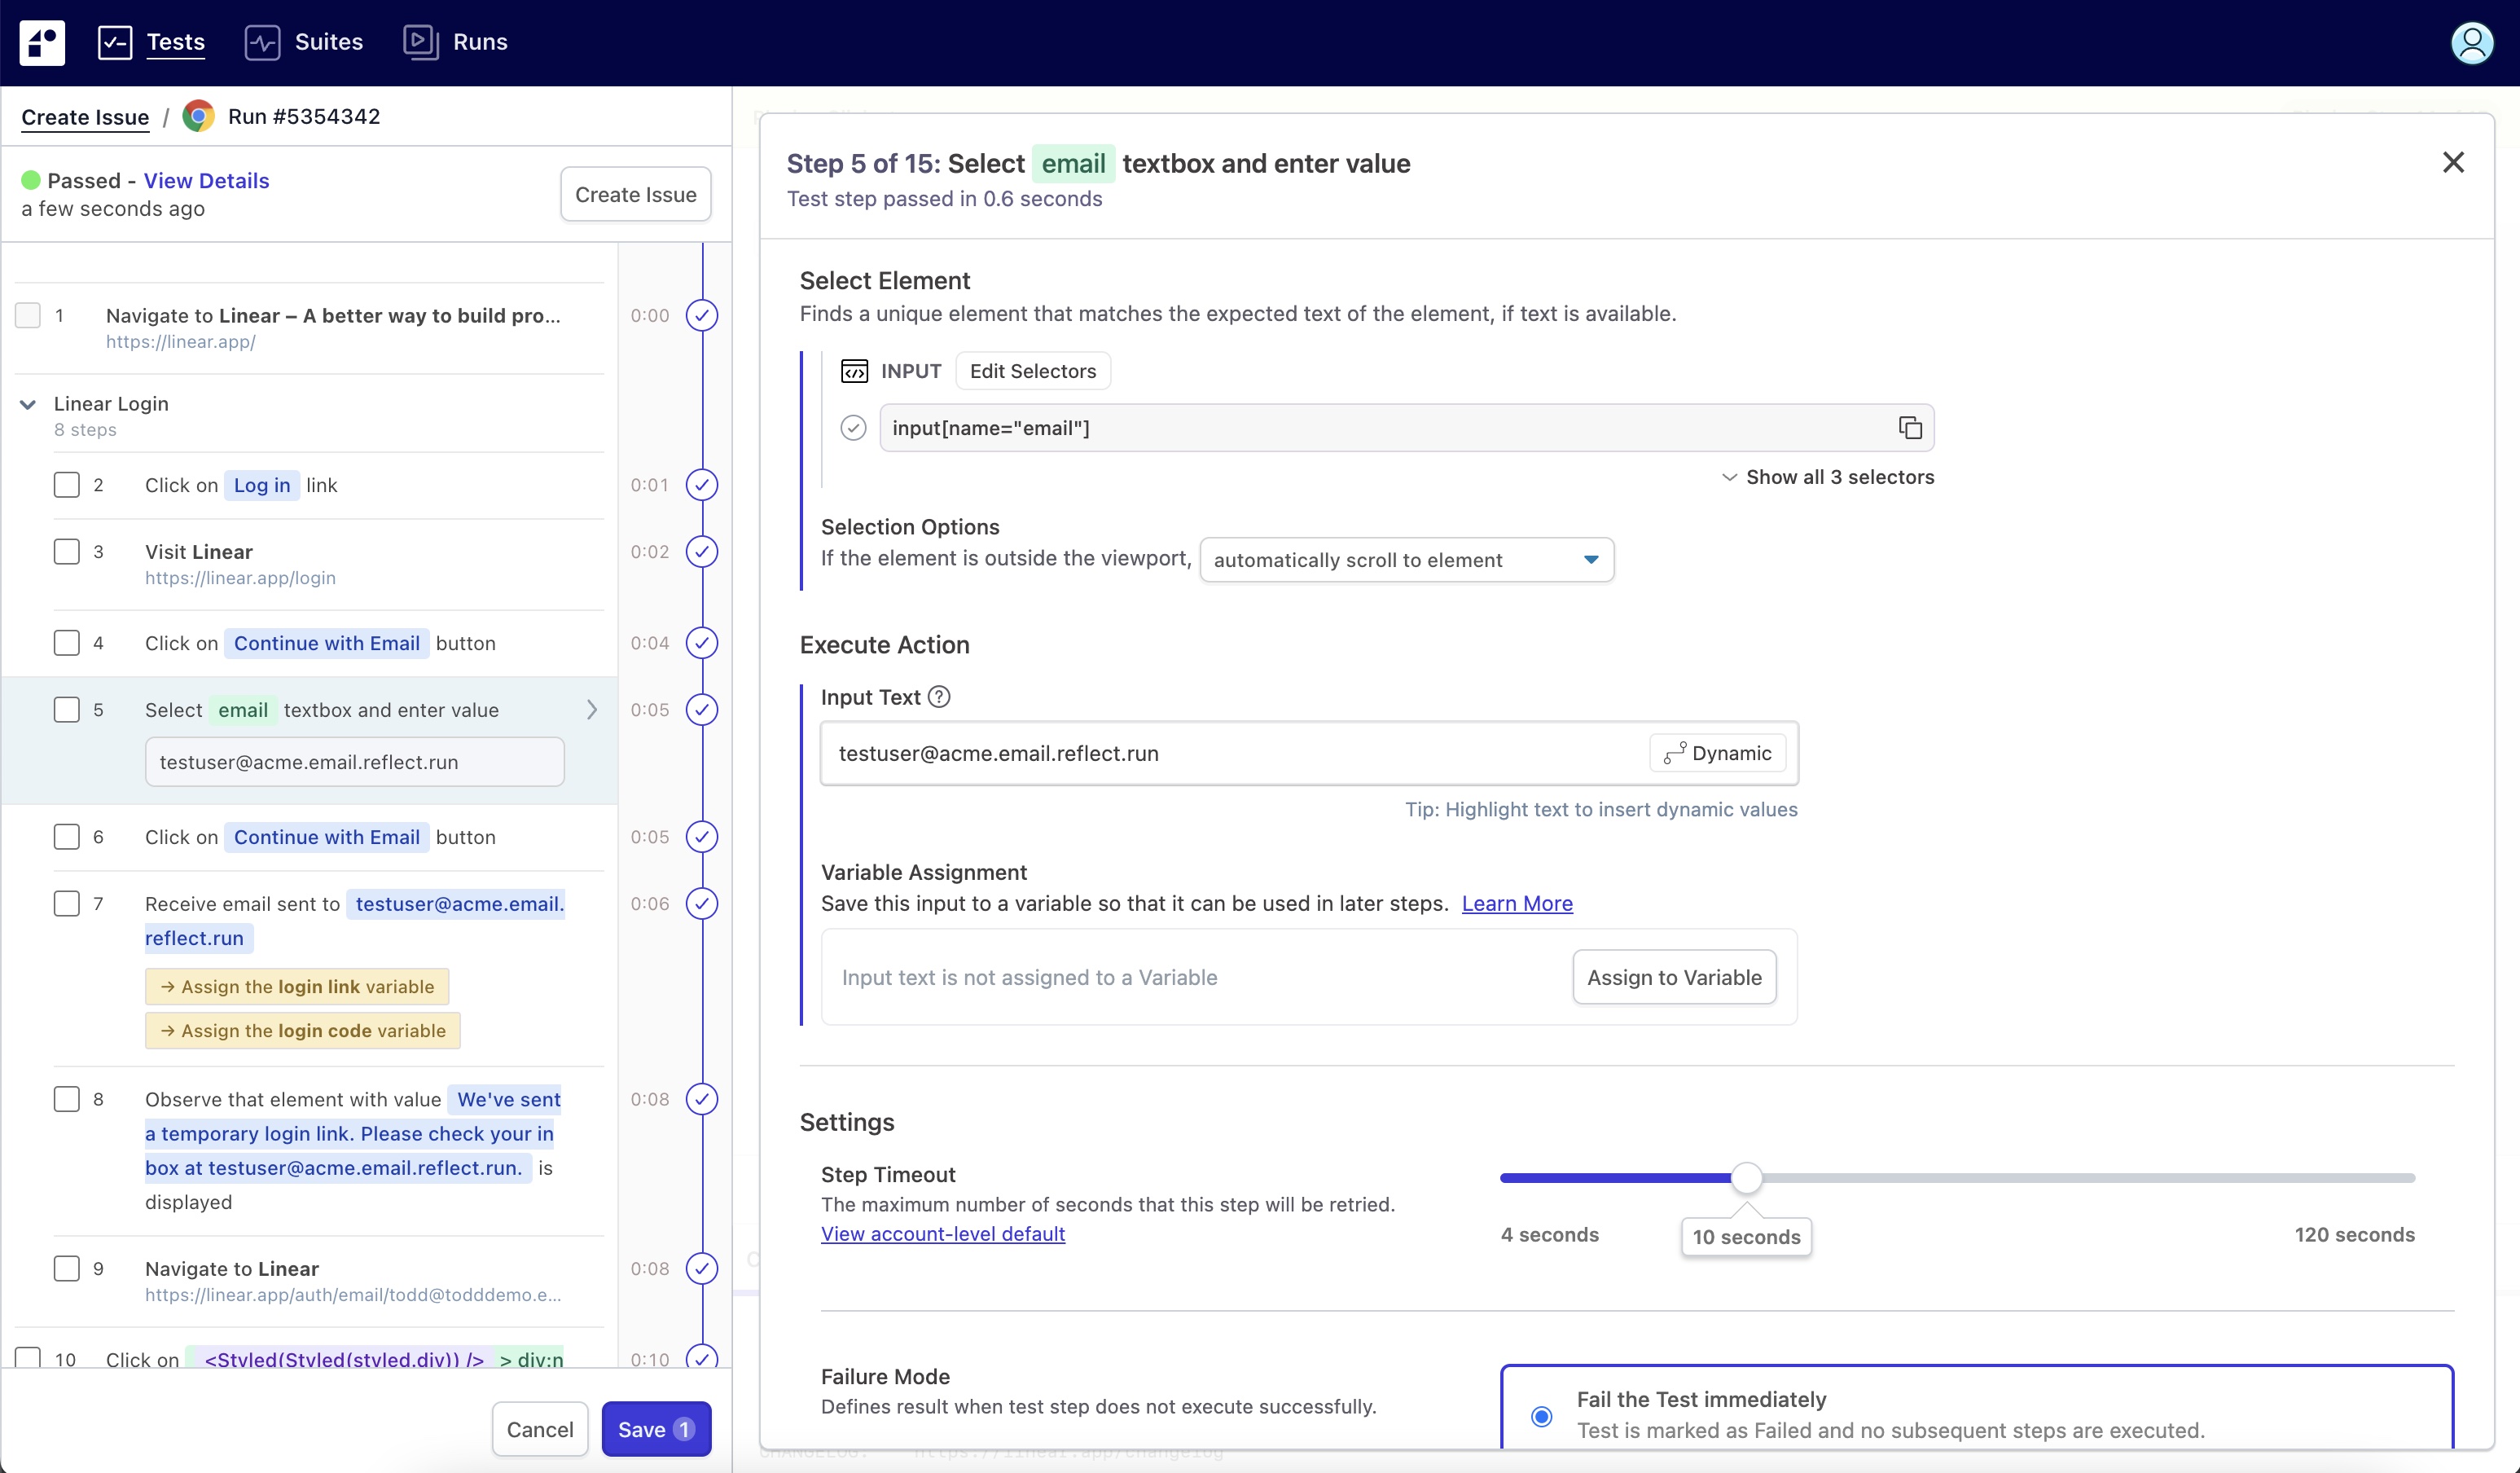
This detail panel is organized into the following sections:
Select Element
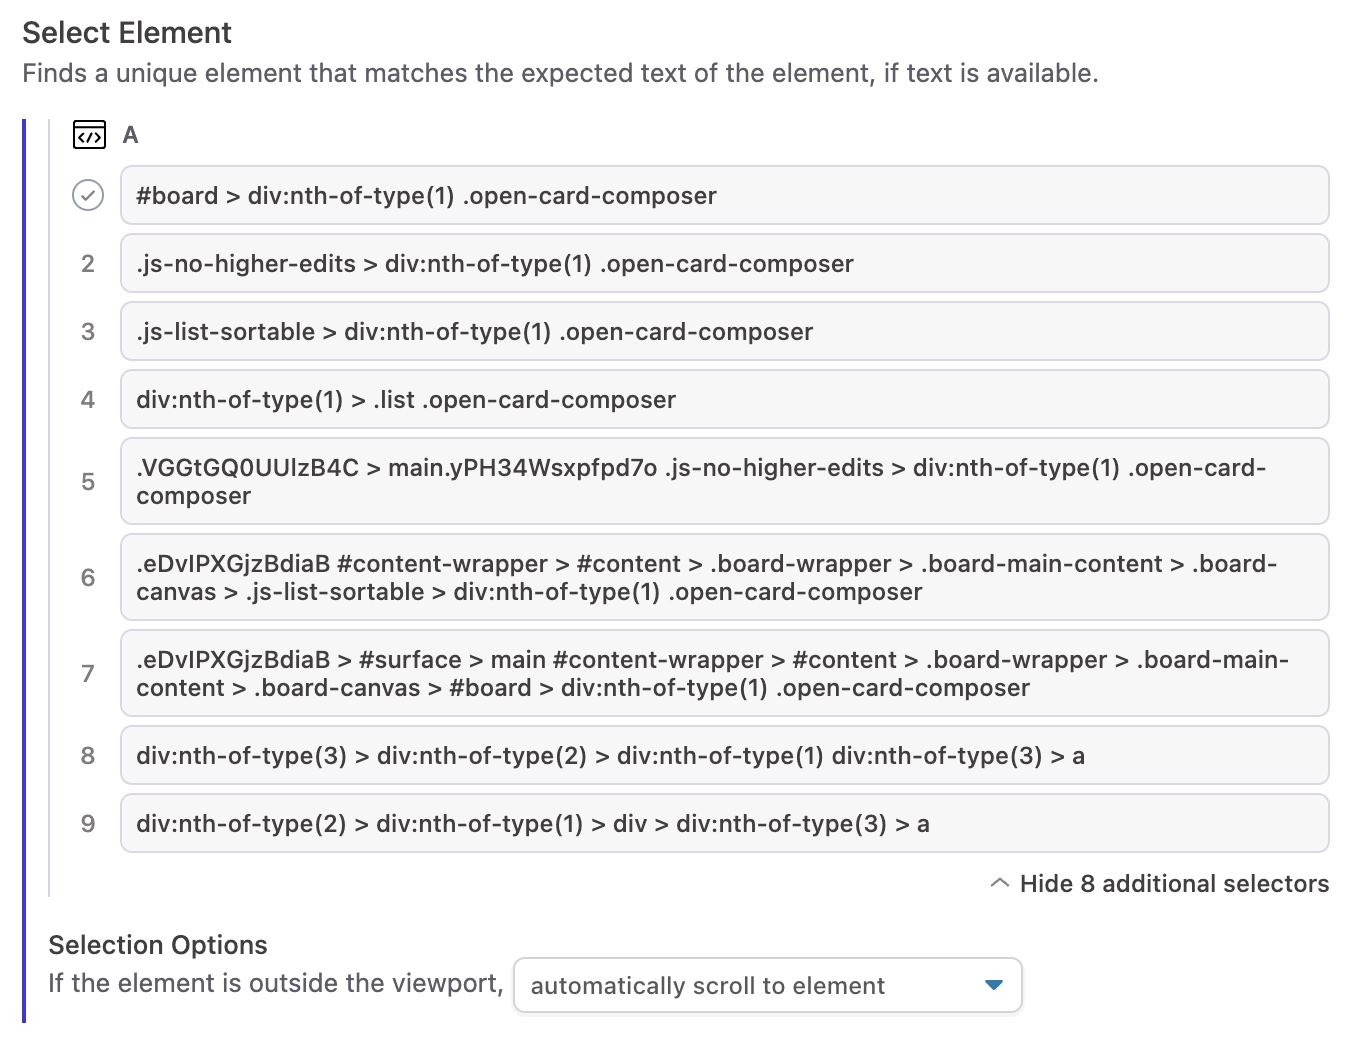
The Select Element section lists the selectors captured during recording which uniquely identify this element. Additionally, this section shows the outcome of using these selectors to identify the element in the current test execution. When a test step executes, Reflect will try each selector one at a time until it finds a unique, visible element. The first selector that matches a unique, visible element displays a green check mark. Any selector that appears below this selector was not attempted during this particular run.
As a page’s HTML changes over time, these selectors may no longer uniquely identify a visible element. If this happens, the selector list displays the reason why the selector failed to find an element. These include the selector not finding any elements (not found), the selector matching more than one element (not unique), and the selector matching an element that is out of the viewport (not visible).
Validate Element
All Text Validation steps, as well as any step that interacts with an element that has visible text, will contain an Expected Text subsection. For failing test runs, this subsection will contain a “diff” view comparing the expected text to the actual observed text during the current test run. In this example below, the expected text was “7:50 PM” but the actual text displayed was “8:57 PM”.

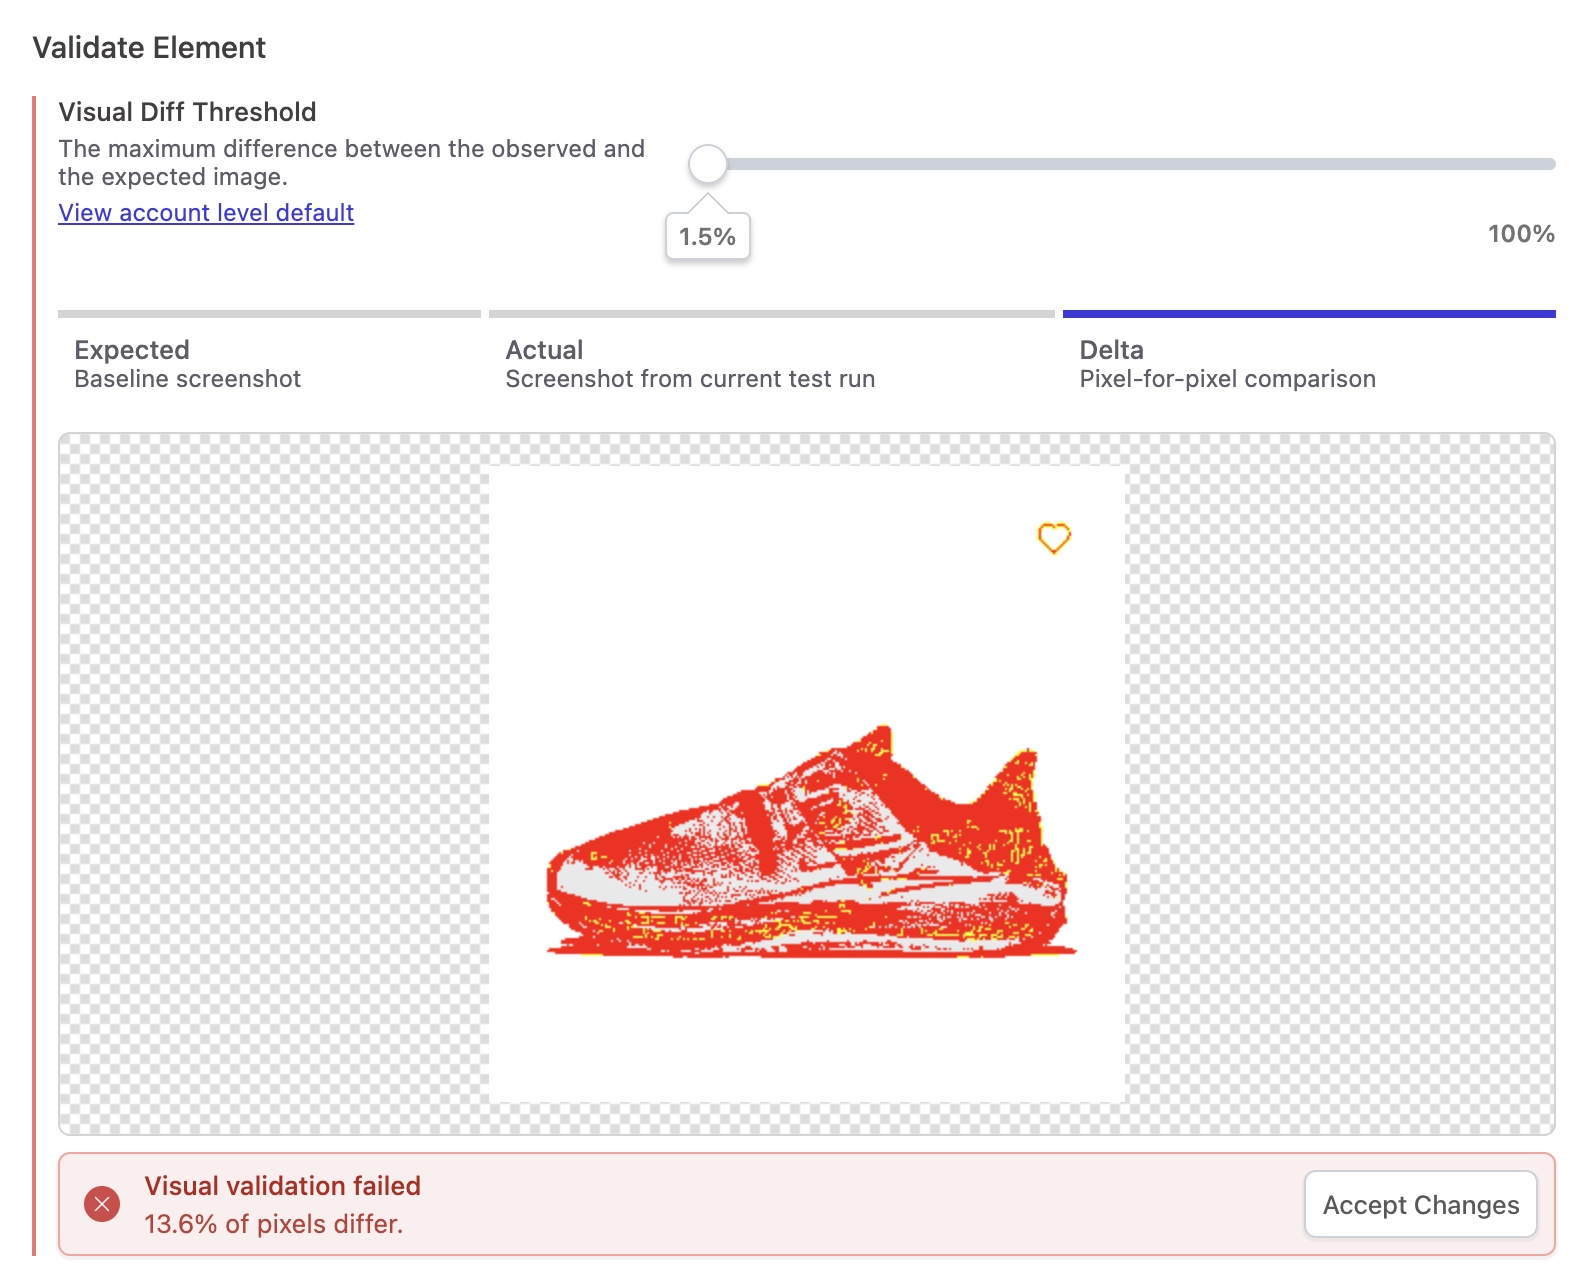
Visual Validation test steps display both the baseline image of the element and the actual image of the element captured during the test run. If the images differ, then a third image, called the “delta” image, is displayed next to the images. The third image shows the pixel-by-pixel differences between the baseline and the actual image, with the different pixels highlighted in red.
Execute Action
If the test step requires entering input text into an element on the page,
either via an input, textarea or contenteditable element,
then the Execute Action section will contain the editable Input Text for this step.

Other steps, such as Click steps, will display the exact x,y coordinates that Reflect will target, relative to the top-left corner of that element.
Test Step Editing
Several of the test step detail sections expose editable elements used to modify the configuration of the test step (and ultimately the test definition). See Test Editing for full information about the editing actions that Reflect supports.

