


Despite the fact that Safari is so popular amongst users, web developers often forgo testing in Safari and instead test solely in Google Chrome. It’s understandable; Chrome has a huge lead in marketshare and has invested a lot of effort in making their developer tools easy to use. What you may not know is that Safari also includes a fully-featured development toolkit that has feature-parity with the major features found in Chrome Dev Tools.
In this article we’ll cover how to find and use the most important features within Safari’s built-in Safari Developer Tools.
Getting Started
One of the biggest barriers to entry in debugging web apps in Safari, and a real head-scratcher in terms of product design choices, is the fact that Safari Developer Tools is not enabled by default on MacOS. Luckily, enabling Developer Tools does not require installing any new software.
To enable Safari Developer Tools, open Safari, click Safari in your menu bar, and then select Preferences. You can
also use Command-Comma keyboard shortcut to open Safari’s Preferences dialog. Locate and select the Advanced menu.
At the bottom of this menu you should see a checkbox that is labeled “Show Develop menu in menu bar”. Enable this
checkbox, and you will now be able to access Safari Developer Tools via a new Develop menu in the Safari menu bar.
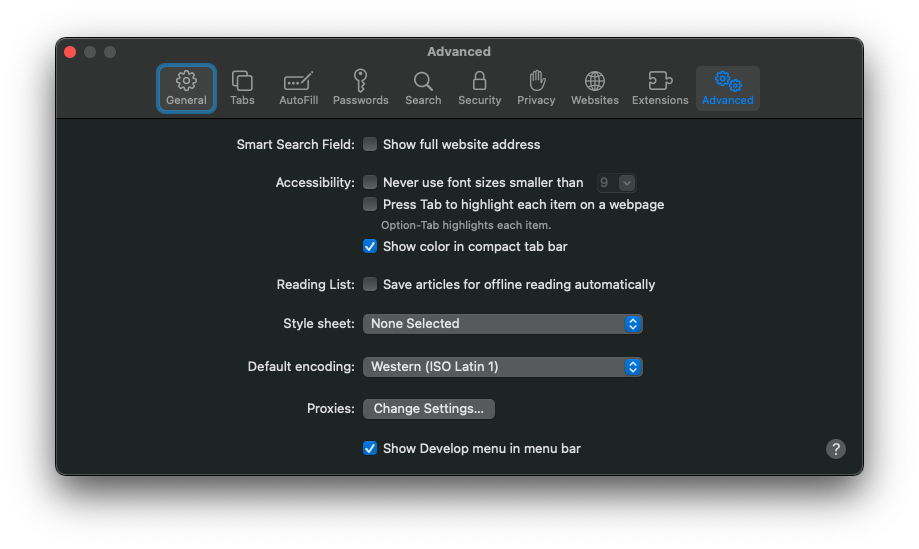
Click the ‘Show Develop menu in menu bar’ checkbox
Now that you have the Safari Developer Tools enabled, you can open the web inspector, console, and network information all from the Develop menu you enabled. By default, these items are docked at the bottom of your browser, but you can choose to have the developer tools appear on the right or left sides, or pop the developer tools window out of the browser entirely.
In addition to the Develop menu, you can now interact with these tools using keyboard shortcuts. These shortcuts make it easy to quickly view the page source via the Web Inspector, or view logs in the JavaScript console. Here is a run down of the tools available for Safari and how to use them.
Target Elements with the Web Inspector
Taking a cue from the Google Chrome Developer tools, the Safari Web Inspector allows you to navigate through the structure of your site as a tree. You can expand elements to see their contents, and open links or images.
The Safari Web Inspector can be used by clicking the Develop menu and selecting the “Show Web Inspector” option. You
can also open the Web Inspector by using the Option-Command-I keyboard shortcut.
View Console Logs
Console log statements are a very common method of testing and debugging a web app. Safari includes a JavaScript console that can be docked to the browser window or displayed in a separate window (which is especially handy for multi-monitor setups). In addition to displaying console logs, the console is also a REPL that lets you write and execute arbitrary JavaScript code that runs within the current browser context.
Importantly, the console allows you to view any logs that may be printed as your app loads new data or encounters errors. Additionally, these logs can persist across sessions by clicking the dropdown menu next to the Logs button in the console, and then select “Preserve Logs”
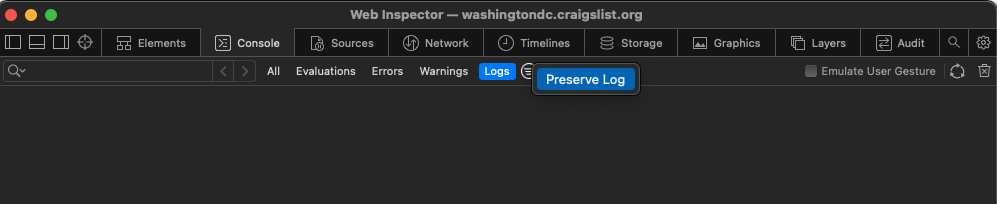
The ‘Preserve Log’ option will prevent logs from being cleared when a new page loads
You can use the Develop menu to open the Safari console by selecting Show JavaScript Console. The console can also
be opened using the keyboard shortcut Option-Command-C. Once the Console appears, be sure to click the Logs button
to view any logs that are currently available.
View Network Logs
The Network section of Safari Developer Tools lets you view the list of network requests that were issued to render the current page. The main table view of the Network tab shows the name of the connecting file, the domain from which it originated, and other useful information like type of file, transfer size, and the amount of time it was in-flight.
Hovering over a specific item in the table will show a legend for the timeline of events, including the length of time each takes to load the required data, color coded by category – Scheduling, Connection, Response, and a section of Totals.
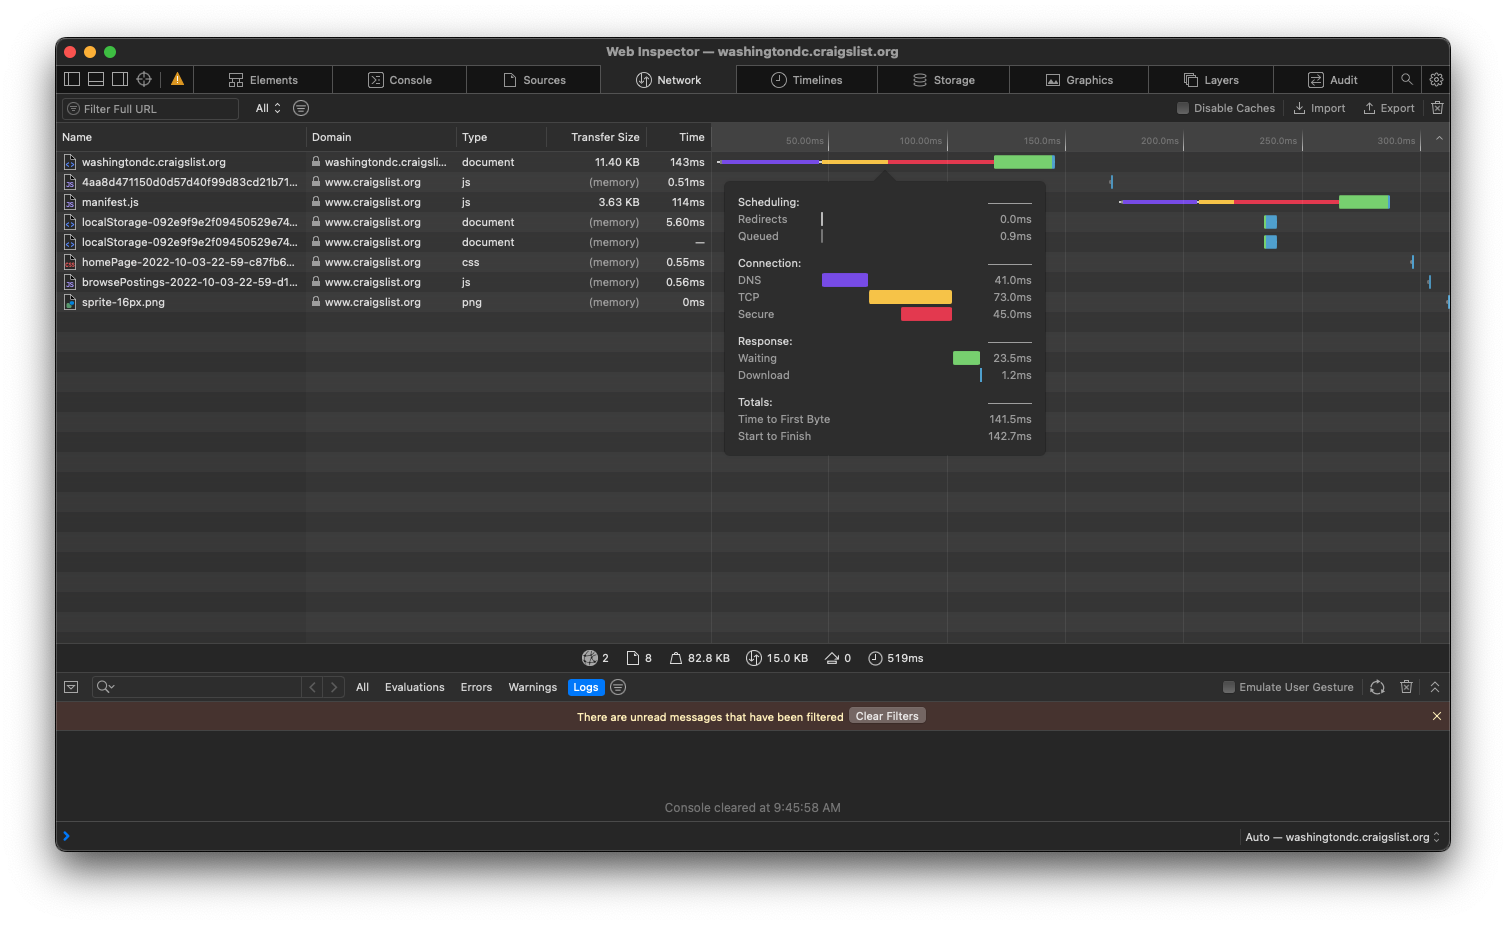
Additional information is displayed when hovering over a network request
You can open the Network tab by opening the Developer Tools window and selecting the Network tab.
Filter Network Traffic
Now that the Network tab is open, you may notice that there is a search bar located at the top left side of the window. You can use this search input to filter the results of this tab to only include your desired Name or URLs.
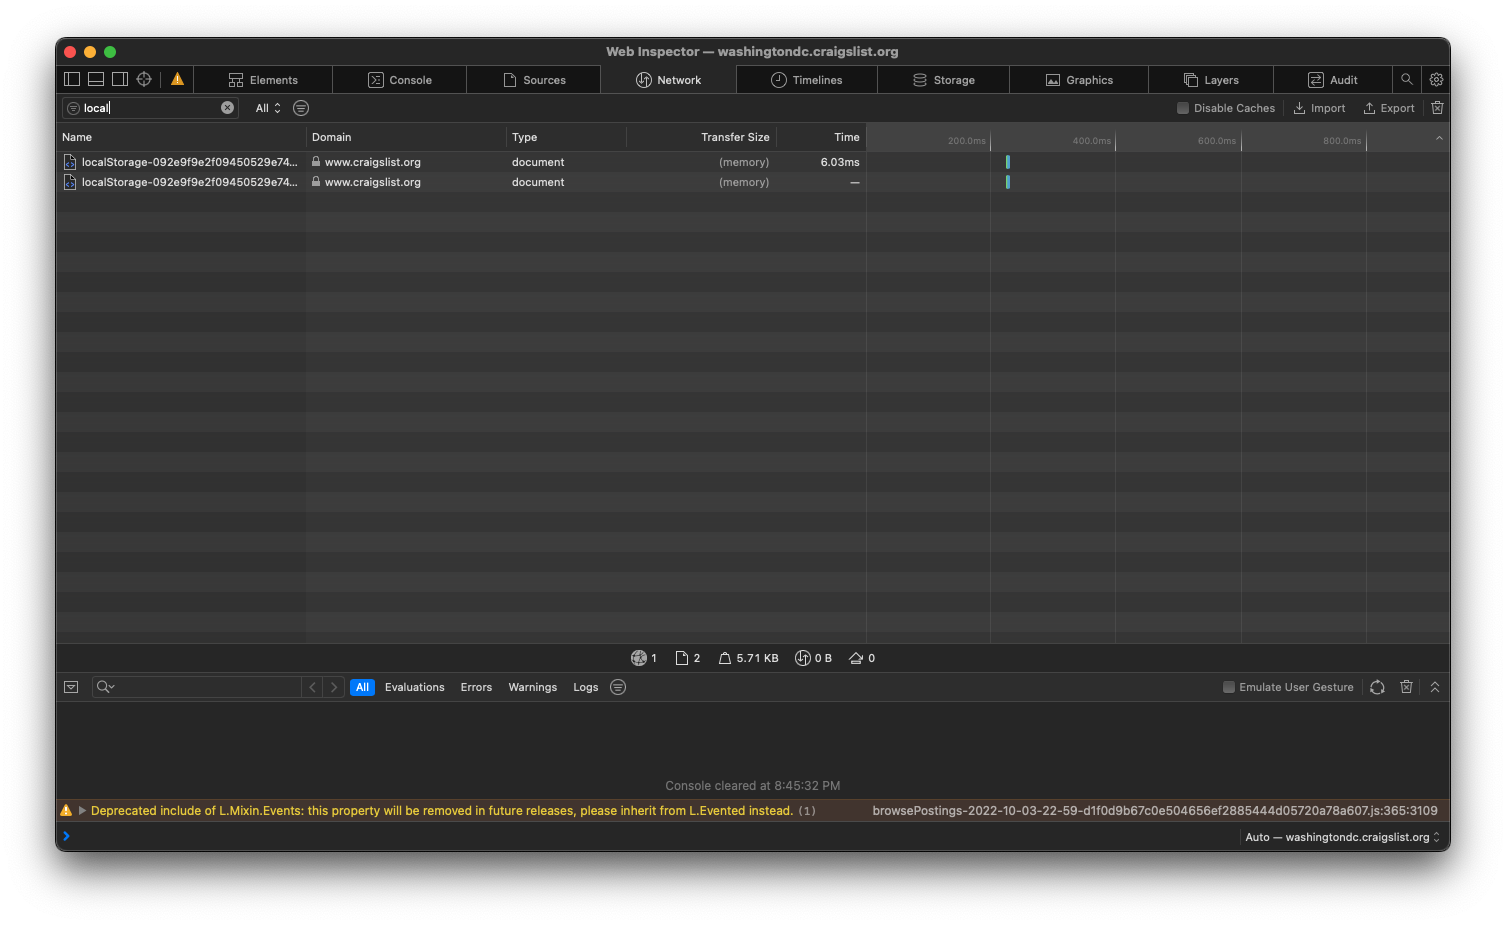
Use the search bar to filter network requests
This network filter is available in the Network section of the Safari Developer tools. To access the filter, open the Network tab in the developer tools window and click the Network tab,
Using the Debugger Statement
Safari Developer tools comes with a built-in debugger that works similarly to the debugger included with Google Chrome.
By including the statement debugger in your JavaScript code, you can trigger Safari to automatically open its debugger
when that line of code is executed. This will open the Sources tab of the Developer Tools window, and breakpoint on the
debugger line, allowing you to step through your code, view global variables, uncaught exceptions, and a list of files
currently loaded on your site.
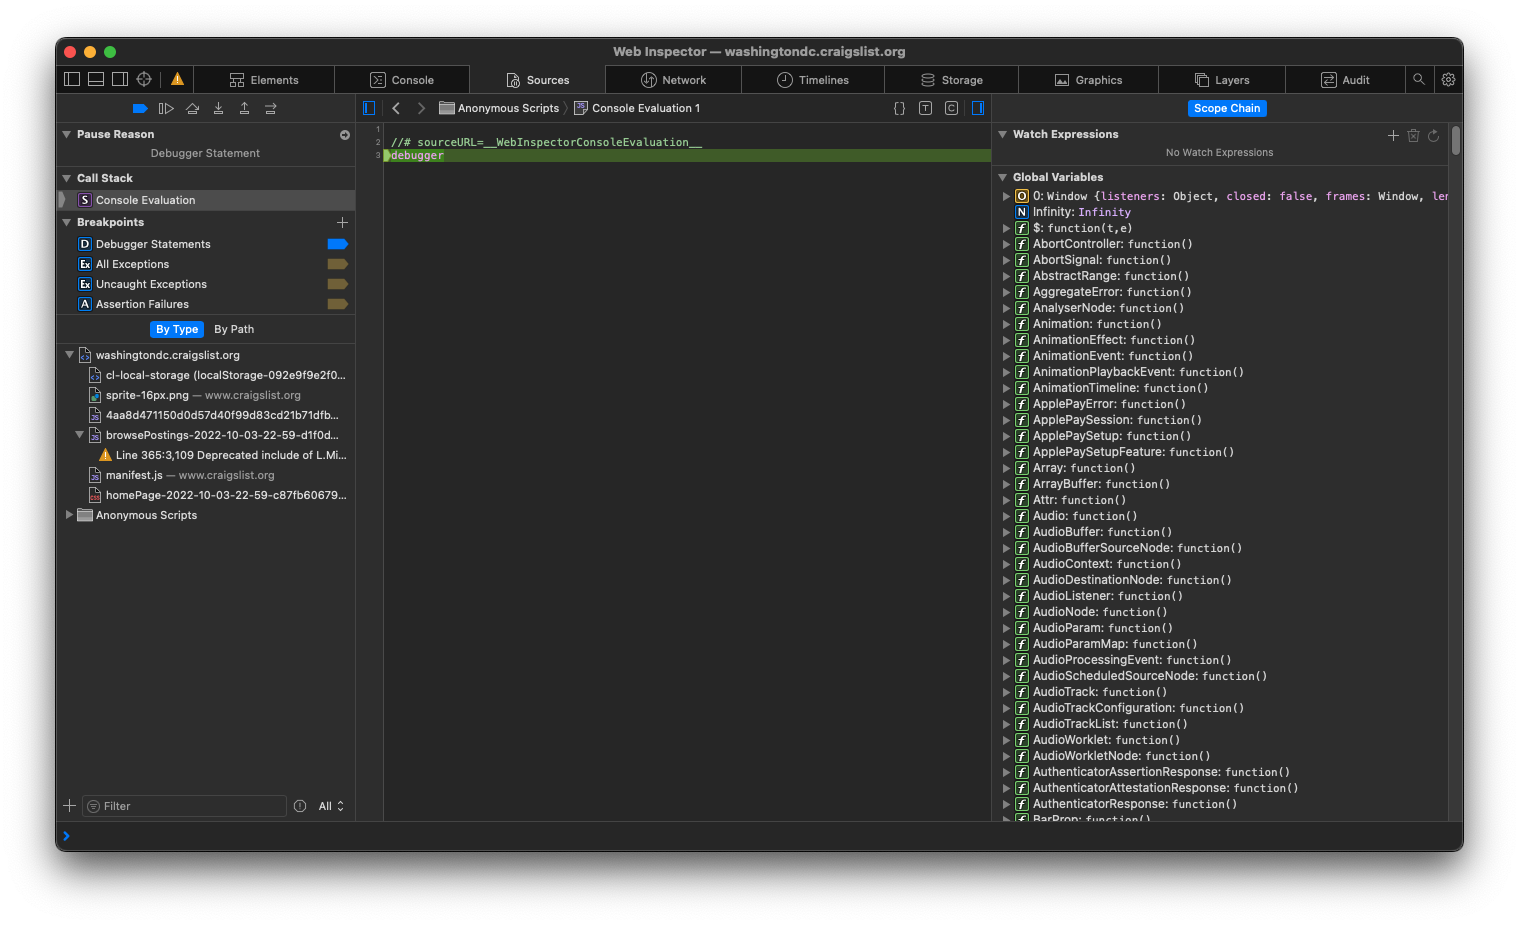
Set breakpoints in JavaScript code on the Sources tab
The Safari debugger is accessible from the Sources tab of the Developer Tools window, or by entering the debugger
command in the console as part of a snippet. You can also use the debugger statement in any JavaScript files sourced
by your app.
Timelines
Like Google Chrome, the Safari Developer Tools offers a view of your side load on a timeline. However, Safari makes the Timeline feature a bit more useful by placing the timeline view in a dedicated section of the Developer Tools window. This provides you with a clear view of resources used by your site for network requests, layout and rendering, JavaScript, and CPU Usage. The Timelines menu even provides screenshots for each major layout change, whether introduced with JavaScript or CSS.
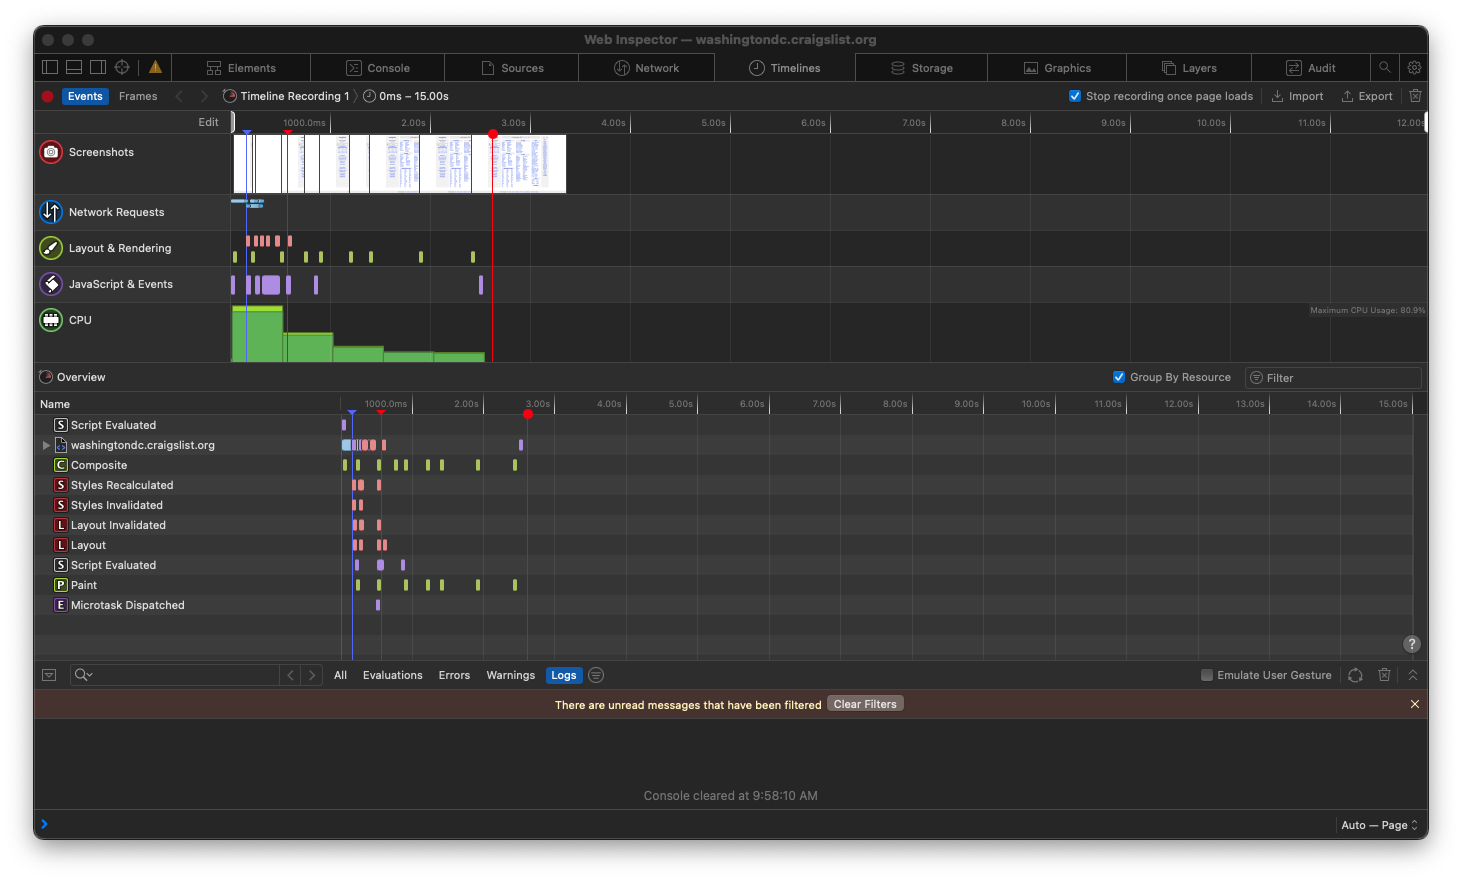
The ‘Timeline’ view displays a detailed account of how the browser rendered the page
Another great feature of timelines is the Timeline Recording process. Start Timeline Recording to view the resources used by your site as you navigate through various pages. When you complete the recording you will see a full list of requests, JS execution, CPU usage, and a screenshot for each change.
Timeline recording of loading craigslist.org
Frequently Asked Questions
Does Developer Tools come pre-installed with Safari?
Yes, Safari Developer Tools comes pre-installed with Safari and MacOS, however it is not enabled by default. This means you will need to update your Safari settings before the Develop menu is enabled and tools like the Web Inspector are accessible.
How do I enable Safari Developer Tools?
Open Safari, and in the menu toolbar select Safari > Preferences. Go to the Advanced section and enable the checkbox labelled ‘Show Develop menu in menu bar’. In the menu toolbar there will now be a new option called ‘Develop’ which contains all of the utilities included in Safari Developer Tools.
How can I select and inspect an element on the page?
There are two ways to inspect an element in Safari Developer Tools:
- In the browser window, right-click on any element and select ‘Inspect Element’
- In the menu toolbar, select Develop > Show Web Inspector (or use the keyboard shortcut
Option-Command-I). This will display the current DOM of the page. Selecting any element from this list will display the details of that element.
How can I see the network requests that the browser is making?
You can open the network monitor by opening the Safari Developer Tools window and selecting the Network tab. The network monitoring section of Safari Developer Tools also contains a traffic filter to help you narrow down specific results.
How can I see the console logs and JavaScript errors in Safari?
You can use the Develop menu to open the Safari console by selecting Show JavaScript Console. The console can also
be opened using the keyboard shortcut Option-Command-C. Once the Console appears, be sure to click the Logs button
to view any logs that are currently available. You can also view other relevant application and logging information in
the Sources tab of the Safari Developer Tools window.
Can you throttle network speed using Safari Developer Tools?
Yes, you can throttle network speed, but it requires you to install Xcode, connect an iOS device, and use the iOS Network Link Conditioner.
How can I test against Safari on Windows?
Reflect is an end-to-end testing tool that lets you create and run tests on Safari. It’s cloud-based, so you use it with any OS or browser. The tests you create run on real MacOS instances in the cloud, and you’ll get a video of every test run, along with console and network logs.
Conclusion
In this article you learned about how to enable the Developer Tools in Safari from the Safari settings menu. You also learned a bit about what the Safari Developer Tools has to offer web developers – fully featured tooling for the number two most popular web browser. For automated, no-code testing of Safari, you can sign up for a free Reflect account here.